On the 20th of March, I tested the 20260320 version of Decodium “Shannon” to see how “Fast Track 2 “performs”. Later tests were done between the 27th and 30th of March.
The first test failed.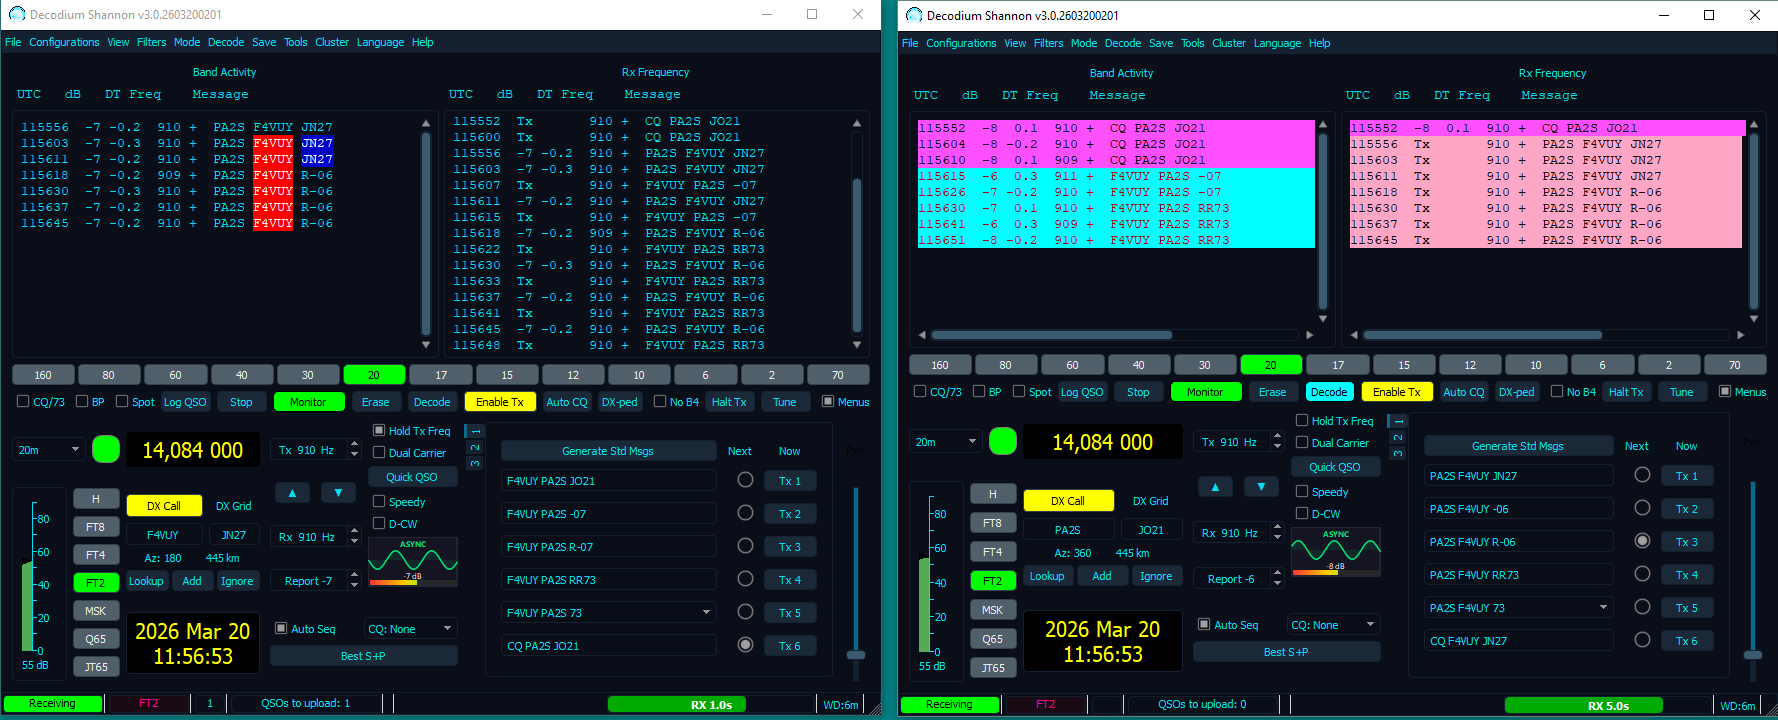
I ran two instances of the software, using Virtual Audio Cable to route the audio internally. Spectrum Lab was used to generate additive gaussian white noise (AGWN), to simulate a somewhat realistic environment.
Two call signs were used, PA2S (left pane) and F4VUY (my French call sign).
PA2S started CQ’ing. No decode by F4VUY. After switching to FT8 and back to FT2, decodes appeared. I double clicked on PA2S and F4VUY started calling. PA2S double clicked on F4VUY at (11)5603, sent -07 but nothing seen by F4VUY. The second transmission of PA2S at 5615 was seen and F4VUY sent R-06 at 5618. Received by PA2S, sent RR73 but it took until 5630 before F4VUY received the RR73. One would expect F4VUY to send 73, but instead, the R-06 reports were repeated and PA2S kept sending RR73 until I stopped the transmissions.
An earlier test was even stranger. I noted that during the “QSO”, things went wrong because both stations started transmitting during the same period. The asynchronous algorithm apparently decided to switch cycles. I also found that when you double click on a call, Decodium starts transmitting during the same period.
Updated versions fixed problems
About a week later, newer versions were tried. This time, the QSO auto sequence was working and QSO’s could be made.
Here is a screenshot of the good test:
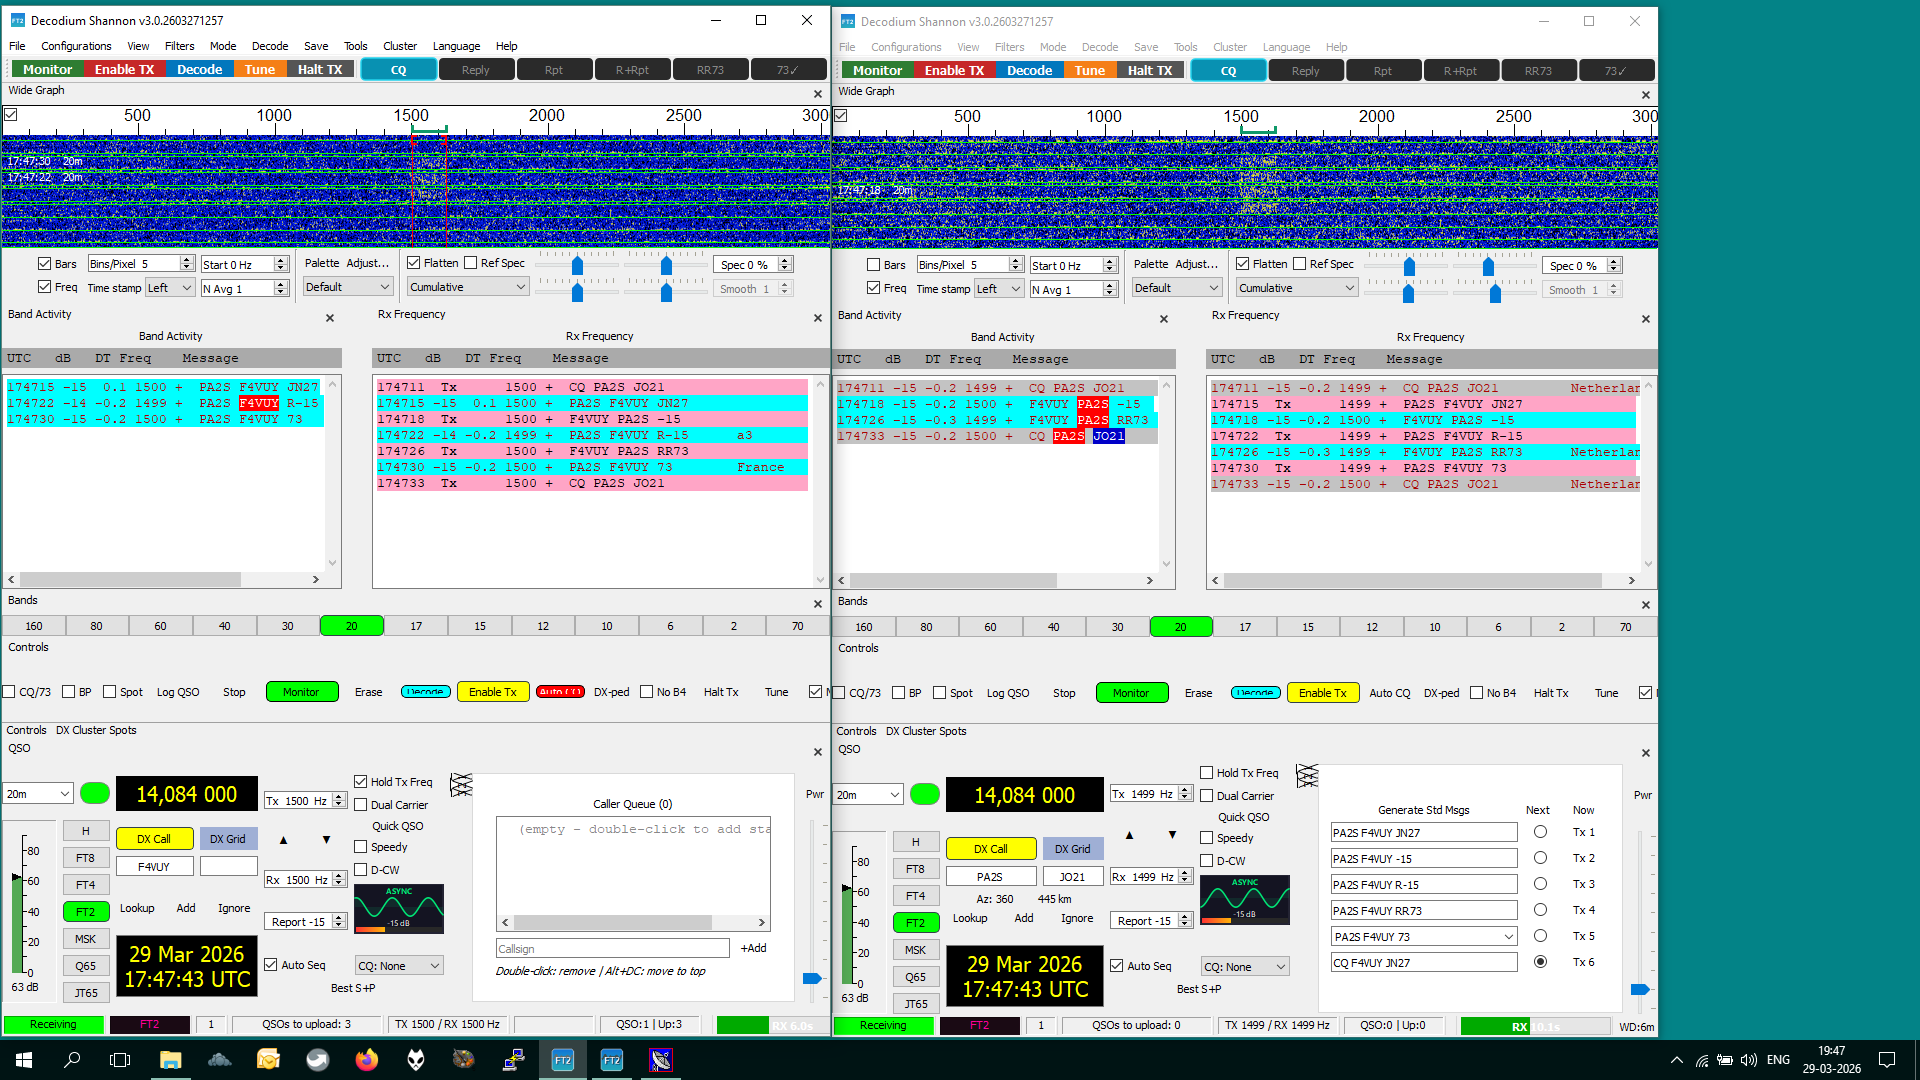
The CQ was decoded immediately and the QSO went smooth.
The above screenshot was of a test with a signal to noise ratio equivalent to -13 dB (SNR’s of JT65 are taken as reference). When the same signal and noise levels are set, FT8 reports the same values as JT65 does.
After the noise level was increased 1 dB (= 1 dB lower SNR of -14), the first CQ was missed and Decodium needed two cycles to show the CQ. I assume that the two periods were averaged. The initial call by F4VUY was missed but also appeared after one repeat. The QSO went smooth, presumably because AP decoding was used (a2 and a3 displayed).
With 1 dB more noise (SNR -15), three CQ’s were needed until it was decoded and the call by F4VUY was first seen after three cycles. The QSO had an extra cycle as well, so with the JT65 equivalent SNR of -15, contacts can be made but things are very fragile. The final 73 was missed.
The “perfect” QSO took approximately 18 seconds (from start of CQ to end of received 73). The last one (-15) took about a minute from the first CQ until 73 was sent (but not received). A lot slower than the “advertised” 6 seconds on ft2.it (which is strange anyway, because the TX duration is stated to be 2.49 seconds and a minimal QSO needs 4 periods. If we assume 300 ms gaps between RX and TX, a minimal QSO requires at least 11 seconds. A full QSO requires 6 periods such as the one shown on the screenshot above).
Decodium sensitivity threshold
In order to determine the “true” threshold, a test was performed with random text (TX5). With these messages, a priori (AP) is impossible and Decodium does not seem to average consecutive cycles (from what I observed).
With JTDX, FT8 messages were decoded solidly down to -19, whereas Decodum decoded 100% at -13. Remember that Decodium reports -15 for this SNR.
Increasing the noise with 1 dB, about 80% of the FT8 messages were decoded (-20), whilst Decodium decoding rate fell to about 33% with -14. One dB lower SNR (-21 FT8 and -15 Decodium) resulted in few FT8 decodes but none for Decodium.
Thus, -13 and -19 are SNR’s can be regarded as the true thresholds (no averaging, no AP).
With AP, sensitivity increases, depending on the amount of AP information. A rough estimate is about 2 dB for the AGWN case (such as the test environment used).
The Raptor engine seems to decode deeper than previous decoders, but needs averaged cycles. Averaging improved the sensitivity but decoding CQ’s failed below -15 (reference JT65).
Extensive experience with FT8 has shown that AP decoding can go as deep as -24 but nevertheless, false decodes are rare. JTDX has saved me many QSO’s!
My conclusion is that with the same transmitted power and with the same background noise level, there is a gap of about 6 dB between FT8 and Decodium FT2, or about 4 times transmitter power to sustain the same reliability. The whole idea behind the weak signal protocols was to gain sensitivity using slow transmissions. Speeding up like FT2 does, reverses this and the sensitivity gain evaporates.
I do not believe the claim that Decodium can get as low as -23 dB SNR (referenced to JT65) with the same power and noise levels. If it could, it would break the Shannon limit. It looks like IU8LMC uses a different metric, thus comparing apples with oranges.
Talking about the Shannon limit
Decodium developer claim a narrow gap between the Shannon capacity when compared with FT8. But that does not mean that FT2 outperforms FT8. Shorter transmissions require more energy for the same reliability. This paragraph tries to explain this.
Before zooming in on the numbers, it is essential to understand that the Shannon-Hartley theorem states the maximum rate of information that can be communicated via an analogue channel with a given bandwidth and signal to noise ratio. The information rate is expressed in bit/second.
It makes sense to try to approach the limit, because the smaller the gap between the actual performance, the more efficient the communication system will be.
The information capacity of a given system (transmitter to receiver and everything in between) can be raised by increasing transmitter power for example, or by using higher gain antennas. More bandwidth can increase the capacity, but the noise power also increases, resulting in a lower signal to noise ratio. Bandwidth reduction improves the signal to noise ratio, but the narrower filters dictate that the bit rate has to be reduced.
If we allow very slow transmissions, filter bandwidth can be reduced, which improves the signal to noise ratio. This fundamental property is the foundation of the weak signal modes.
SNR per tone
First, I will discuss the “true” SNR per tone. Let me give an simplified explanation of the signal.
The JT signals like JT65, FT8 etc. are a species of the class M-ary orthogonal FSK signals. It resembles musical notes, played at fixed intervals. Each tone represents a binary number. FT4 and FT2 use 4 tones, FT8 uses 8 tones.
The number of tones is equal to the number of different binary values that can be transmitted during one tone interval. In binary terms, this corresponds to 2 or 3 bits.
A receiver consists of a set of filters, each tuned to one of the tones. The receiver further has a sampling and decision circuit to determine which tone was strongest. Of course, this is nowadays done with signal processing software, but the fundamentals remain the same.
The optimum filter bandwidth depends on the tone spacing and duration of the tones. If the filter is too narrow, time constants hinder detection (like a very narrow CW filter). Too wide filters will pass a part of the adjacent tone and cause errors. So there is an optimum and filters are designed to match that optimum.
As explained before, the filter bandwidth determines the amount of noise power. Detection requires the signal (tone) power to be stronger than the noise. Because only one tone is transmitted at the same time, one filter has more signal (signal plus noise) than the others (only noise).
Joe Taylor (et al) chose to express the JT signal to noise ratio (SNR) in dB, relative to a passband of 2500 Hz (SSB). If we would have a (digital) filter with 1 Hz bandwidth, the noise power at the output would be 2500 times less than the unfiltered 2500 Hz passband. This ratio equals 33,98 dB less, rounded to 34 dB.
Let’s suppose we have a very narrow M-ary FSK signal with tones just 1 Hz apart. We would then use matched tone filters with a bandwidth of 1 Hz. If we transmit a carrier (tone) which is 10 dB above the 1 Hz noise, it would be +10 minus 34 = 24 dB below the noise power of 2500 Hz bandwidth. That is the somewhat strange method which K1JT defined for the JT family of modes.
We will now calculate the noise power relative to 1 Hz for JT65, FT8 and FT2. We assume the noise to be AGWN (equal for all frequencies). We assume the filter bandwidth to be the same as the tone spacing.
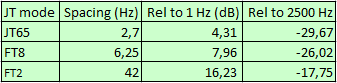
The centre column states the noise power (in dB) for the filter bandwidth of each mode. The table also shows that noise power relative to 2500 Hz (right column). The values are 34 dB below the 2500 Hz noise power (see above).
We can use this table to convert the reported SNR values (of WSJT-X etc) to the SNR for each tone above the noise level of the corresponding filter. As an example: when WSJT-T reports -16 dB, the FT8 tone power is 10 dB higher than the filter noise. A report of -26 would imply that the tone power equals the noise power and it is easy to understand that decoding is practically impossible. But JT65 would still see an SNR of 4 dB and there is a chance that it can be decoded.
So, with this table we get an idea of the “true” SNR per tone.
The FT8 threshold was measured to be about -19 (relative to 2500 Hz) and that is 7 dB stronger than the -26 dB value. It implies that the SNR in 6,25 Hz bandwidth is 7 dB. We will remember this value.
The FT2 threshold (same reference) is -13 and that is 4.75 dB stronger than the 0 dB value of -17.75. We also take note of the 4.75 dB value.
The test showed that Decodium stopped decoding with 2 dB lower SNR values, where FT8 decoded a few. This corresponds to respective tone SNR’s of 5 and 2.75 dB.
The Shannon limit
The Shannon maximum throughput, measured in bit/s, is W * log2(1+S/N) where W is the bandwidth (Hz), S and N are the signal and noise power (S/N as a ratio, not in dB).[1]
7 dB (FT8 tone SNR, see above) corresponds to a ratio of 5,01
For FT8 we get 6.25 * log2(1+5,01) = 16.2 bit/s.
The FT2 tone SNR was 4.75 dB which is 2.99.
So we get we get 42 * log2(1+2.99) = 83.8 bit/s.
The actual throughput (77 bit message) of FT8 is approximately 8 bit/s and for Decodium about 41 bit/s.[2]
If we divide the values for each mode we get:
FT8: 8/16 = 0.51 or 2.92 dB
FT2: 51/84 = 0.49 or 3.1 dB.
Conclusion: distances from the Shannon capacity limit are almost equal.
Note about occupied bandwidth
Many statements about the occupied bandwidth assume the frequency difference between the lowest and highest tone. In my opinion, this is incorrect.
A sharp cut off above and below those tones would simply make decoding of these tones impossible. If we assume matched filters with a bandwidth of the tone distance, the outer tone filters extend to about half the bandwidth at each side. This implies that the occupied bandwidth is (number of tones +1) * tone spacing.
We than get:
FT8: (8+1)*6.25 = 56.25 Hz or 1.125 times the outer tone spacing
FT2: (4+1)*41.75 Hz = 208.75 Hz or 1.25 times the outer tone spacing.
If we translate that into the Shannon capacity, is implies that the FT2 channel is relatively speaking a bit wider than the FT8 channel. This corresponds to nearly 0.5 dB.
Note about averaging
Averaging increases the transmission time and that implies that the actual throughput decreases. In case two periods are needed and we assume twice the transmission time, the bitrate is halved. The distance from the Shannon limit increases because the actual throughput is lower.
Propagation distortion and interference in the real world situation limit averaging gain.
The -23 sensitivity claim versus the Shannon limit
The table above shows that the 0 dB SNR (2500 Hz) is -17.75. The -23 claim (no averaging) would result in an SNR of -5.25 dB! The Shannon capacity would be less than half the actual FT2 throughput.
============
[1] Mathematician Claude Shannon developed these fundamental properties for a given communications channel. It was published in 1948 and still stands today.
[2] The value is based on the stated TX time of 1.89 s. It also assumes the filter bandwidth to be equal to the tone spacing.