Currently, I am working on a paper regarding propagation on 60 metres. Transmissions with JT mode were used to collect spots and create datasets.
A valuable datasource is wsprnet.org, to which WSPR spots are uploaded and fed to a database. The data can be downloaded.
In order to support the study, I developed a WSPR viewer. As I am especially interested in 60 m, I filtered the 60 m spots and put these in a database. With the application, pairs of receiving/transmitting stations can be selected and the spots can be plotted on a graph. It has options to show a month or just one day. There is an option to accumulate spots, for example by selecting a reporter and plotting several transmitters.
Here are some examples:
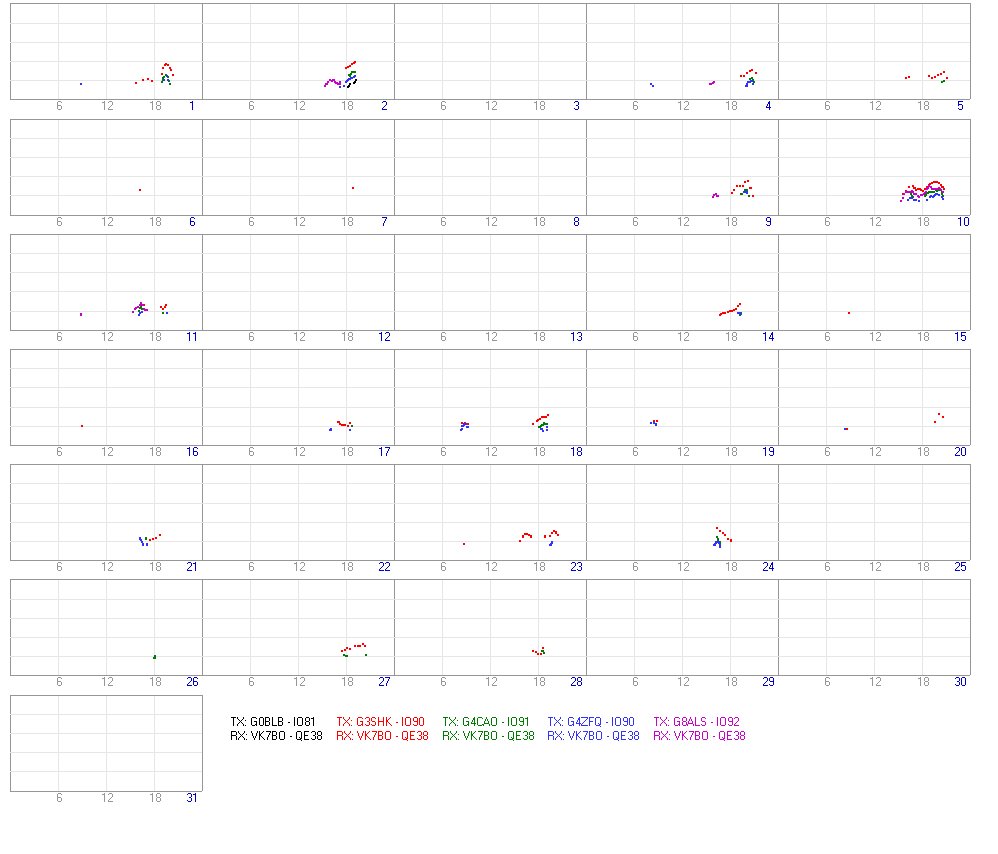
The picture shows the month January 2017 with signals from a number of British stations received by VK7BO.
During some days, long path propagation occurred (morning in Europe). After sunrise, the D-layer absorption starts to build and the signal strength fades. During the late afternoon, sunset nears and the band opens via the short path. About one hour after sunrise in Australia, the D layer absorption at the Australian end builds and the signals drop.
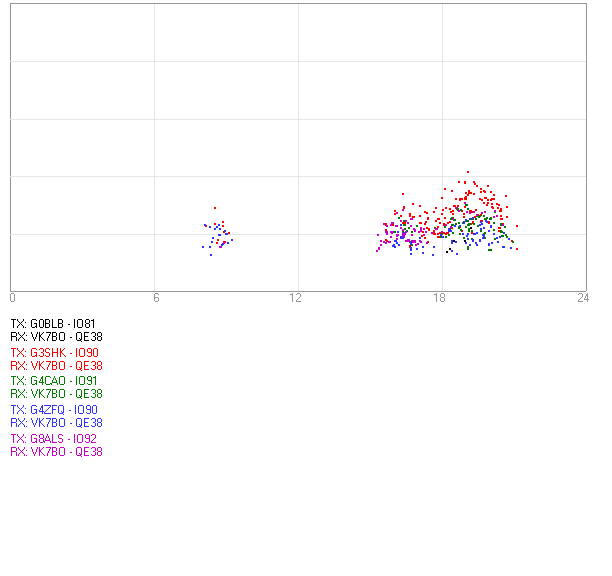
The next graph shows all the spots accumulated on one page, indication the times with the highest probability for an opening. Times are all UTC. More to follow soon!
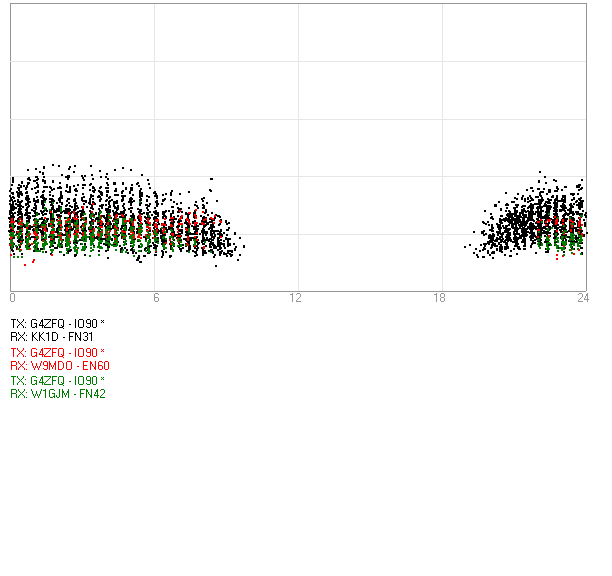
Next, a graph of G4ZFQ as received by some stations in the USA.
KK1D has a receiving setup running 24/7. On his website, you can see that Josh has quite a lot of gear running, resulting in nice series of observations. The time range is Oct 2016 through Jan 2017.
Conditions are remarkably reliable!