
One of the latest developments is a parser/analyser for the ALL.TXT files that WSJT-X and JTDX create.
The ALL.TXT file contains all sent and received messages and as I wanted to have a tool to retrieve the data in a structured way, I decided to write a parser. It is made in Visual Studio 6. Some may laugh at this >17 years old environment, but I can assure you that it is still perfect. Just because it does not have many bells and whistles, it is just right. It loads within a second! Try that with modern environments!
Anyway, the output is pretty good now and I get what I want. Calls and grids are verified against lists of calls (tnx JTDX developers for publishing the file) and is ready to load into a database.
I wanted to be able to view things on a map, along with ionospheric maps and when playing with it, I created the possibility of plotting QSO’s. I will leave that feature in it, as it is a nice addition anyway.
The screenshot below shows how it looks. The calls of the stations are printed on the screen as well, although in dense areas, there are too many. But the DX is well visible. Note the funny effect that when more stations from the same grid and with the same prefix were worked, you see the prefix with mingled suffixes:-)
My goal is to have a toolkit to analyse propagation, it should a.o. be capable of plotting signal strengths with time (like the scatter graphs I published here) and along with other datasets. It will take some time, so I will be back with more results.
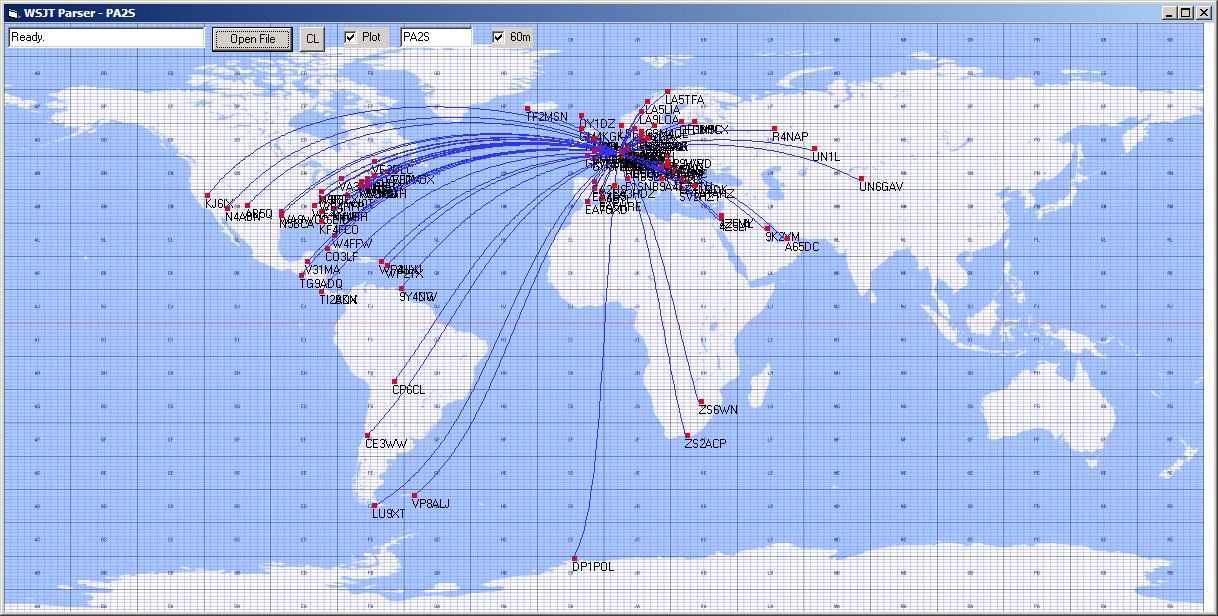
Plot of JT contacts of PA2S on 60 m
The screenshot is 1218 pix wide, so use a large setting to view it 1:1.
It has to be noted that, because of the map projection, the correct paths to stations are not straight lines, especially when the paths cross the polar regions. It will be taken care of, but it is alpha-alpha, remember:-)
Update 7 Jan 2017 21:28
It took a bit of effort, but got the so called orthodromes to work, so the routes are now plotted correctly on the cylindrical map projection.
Update 22 Jan 2017
Over time, the development progresses. The plotting features were extended and a “live” version is up and running. It parses the ALL.TXT file every minute and displays the activity.
Here is a screenshot of a plot, with a filter on my showing the stations worked.
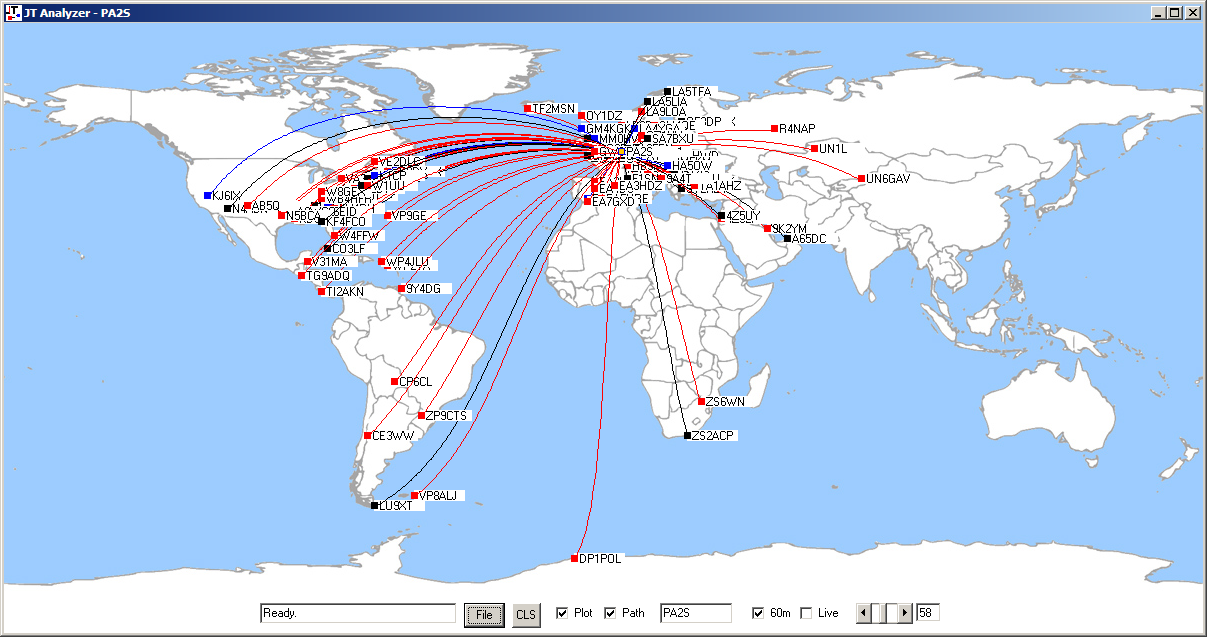
Stations worked by PA2S